








Duplex sequencing of 2.5 million mt-genomes
To investigate how mt-haplotype and mito-nuclear concordance influence the distribution of mt-genome somatic mutations, we employed a panel of conplastic mouse strains. These strains are inter-population hybrids developed by crossing common laboratory strains with the C57BL/6J (B6) mouse line38. Each conplastic mouse strain carries a unique mt-haplotype on a C57BL/6J nuclear genomic background (Fig. 1a). This fixed nuclear background enables us to attribute differences in somatic mutation to changes in mt-haplotype. Alongside a wild-type B6 mouse, we used four conplastic mouse strains that exhibit changes in metabolic content and processes, or altered ageing phenotypes (Supplementary Table 1). Three of these conplastic mouse strains differ from the C57BL/6J mt-haplotype by just 1–3 non-synonymous variants, while a single strain (NZB) contains 91 variants distributed across the mt-genome (Fig. 1b and Supplementary Table 1). We sampled brain, liver and heart tissues from each of these mouse strains in young (2–4 months old) and aged (15–22 months old) individuals to examine how ageing and metabolic demands shape the mutational spectrum in distinct physiological contexts. In total, three tissues were sampled from five mouse strains at two different ages over three to four replicates per condition, resulting in n = 115 samples.
Fig. 1: Overview of experimental design.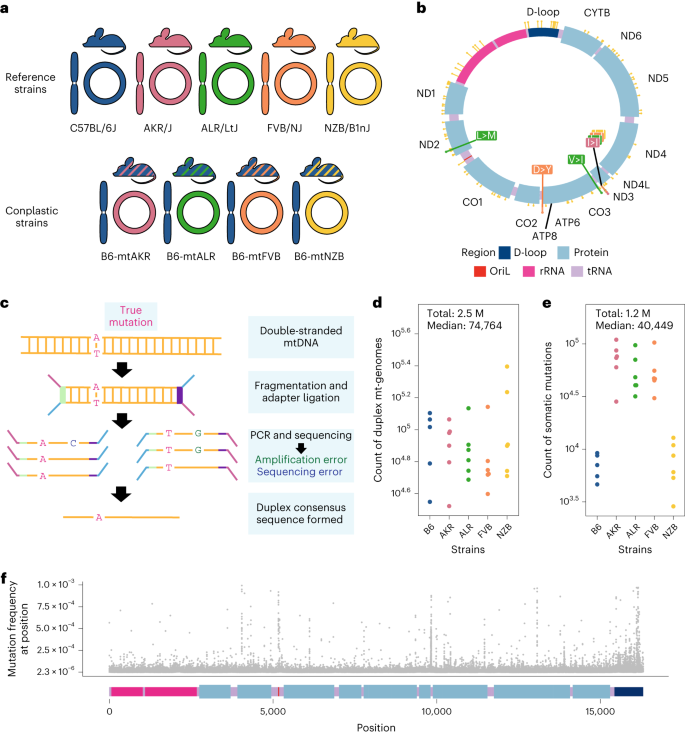
a, Maternal donors were selected from common inbred strains (CISs) containing non-synonymous variants with functional effects. Females from these CISs (pink, green and orange) were backcrossed with a C57BL/6J mouse (blue). This process was repeated with a wild-inbred strain (yellow). The result of these crossings are conplastic mouse strains (denoted by the striped mice). These conplastic strains have identical B6 nuclear (linear) genetic backgrounds but differ by variants along their mt-genomes (circular). b, B6-mtAKR (pink), B6-mtALR (green) and B6-mtFVB (orange) differ from wild type by one to three non-synonymous variants. B6-mtNZB (yellow) contains 91 variants distributed across the mt-genome (14 non-synonymous and 56 synonymous mutations). The synonymous mutation in MT-ND3 is shared across conplastic strains. For a more detailed account of these variants and their associated phenotypes reference (Supplementary Table 1). c, Ultrasensitive duplex sequencing (DupSeq) was used to profile mt-genomes from conplastic mice. DupSeq has an unprecedented error rate of <10−7. Each double-stranded mtDNA fragment is distinctly tagged with a unique molecular barcode, allowing for the computational construction of a duplex consensus sequence. As a result, both polymerase chain reaction (PCR) and sequencing errors are filtered from the data. d, The count of duplex mt-genomes sequenced was calculated for each experimental condition (n = 29 conditions; n = 4 mice for every condition with three mice for B6-Young-Heart). The duplex read depth at each position was aggregated across samples in a condition to quantify the duplex depth per condition. The average duplex read depth across the mt-genome was then calculated. An estimated 2.5 million mt-genomes were duplex sequenced with a median of 74,764 mt-genomes duplex sequenced per condition. e, Approximately 1.2 million variants were identified with a median of 40,449 variants per condition. The count of variants was aggregated across samples in a condition. Mutations present at conplastic haplotype sites were filtered from the analysis. f, The mutation frequency for each position is mapped along a linear representation of the mt-genome. Each point denotes the mutation frequency for an experimental condition at the given position in the mt-genome. Legends for the mt-genome map are consistent with those in b. Positions with a mutation frequency greater than 1 × 10⁻³ were excluded from this analysis.
To capture low-frequency variants and accurately portray the somatic mutational landscape, we used ultrasensitive duplex sequencing to profile mt-genomes across different experimental conditions33. This approach works by tagging double-stranded mtDNA sequences with molecular identifiers and computationally constructing a duplex consensus sequence (Fig. 1c) resulting in error rates of ~2 × 10⁻⁸. Importantly, duplex sequencing data can contain an artificial enrichment of G > T, C > T and G > C mutations resulting from DNA damage during sequencing preparation steps39. To exclude potential erroneous calls, we trimmed 10 bp from our duplex reads (Supplementary Note 1 and Supplementary Fig. 1). Additionally, we analysed the mutational spectra for atypical imbalances of complementary mutation types and compared our mutation type proportions with a previously published study37 (Supplementary Figs. 2 and 3, and Supplementary Tables 2 and 3). Using this approach, we profiled ~2.5 million duplex mt-genomes, with a median of 74,764 duplex mt-genomes sequenced per condition (strain × tissue × age) (Fig. 1d). This resource allows for the detection of somatic mutations at a frequency of 4 × 10⁻⁶.
Duplex reads from each sample were mapped to the mouse mt-genome (mm10) and variants were called using a duplex sequencing processing pipeline (Methods). Mutations overlapping conplastic haplotype sites were filtered out. In total we identified 1,171,918 somatic variants, with a median of 40,449 somatic mutations per condition (Fig. 1e). From these ~1.2 M mutations, 81,097 mutations are unique events. These variants were distributed across the entirety of the mt-genome (Fig. 1f).
Haplotype- and tissue-specific mutational hotspots
Somatic mutations accumulate with age across both nuclear and mitochondrial genomes24. We observed this trend consistently across tissues and mt-haplotypes with the mutation frequency on average ~2-fold higher in aged mice compared with young mice (Fig. 2a). This trend was most pronounced in the liver (2.5-fold higher) and smallest in the heart (1.6-fold higher). Additionally, the heart sustained the lowest mutation frequency on average (Fig. 2a), despite its high metabolic demands as demonstrated by its higher mitochondrial copy number (Supplementary Fig. 4). Comparing age-associated mutation rates across different strains we find AKR, ALR and NZB all exhibit strain-specific mutation rates (Supplementary Table 4; P value <0.01, log-link regression). The FVB strain, which only differs from B6 at two sites (Fig. 1b) showed no evidence of strain-specific mutation rates compared with wild type. AKR and ALR strains had lower mutation rates across all tissues, while NZB exhibited strong increases in the brain and decreases in the heart.
Fig. 2: Region-specific changes in somatic mutation frequency with age.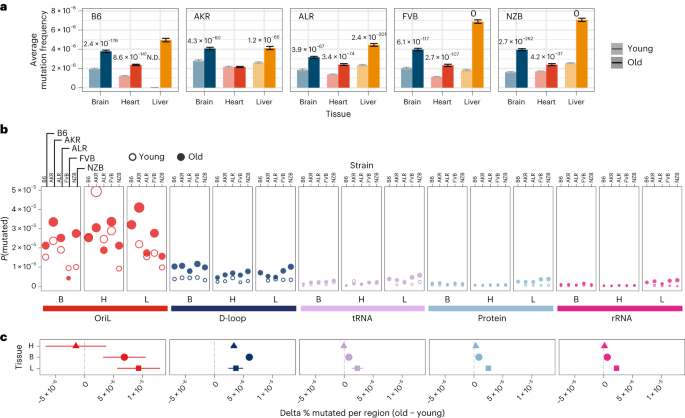
a, The average mutation frequency for young (light) and aged (dark) mice in each experimental condition (n = 29 conditions; n = 4 mice for every condition with three mice for B6-Young-Heart). Mutation counts and duplex depth were aggregated across samples for each condition. The mutation frequency for each position along the mt-genome was calculated by dividing the total count of alternative alleles by the duplex read depth at the position. The bar denotes the average mutation frequency across positions in the mt-genome. Error bars denote the 95% Poisson confidence intervals. P values indicate experimental conditions with a significant age-associated increase in mutation frequency. The P values were calculated from a log-linear regression and adjusted using a Bonferroni multiple hypothesis correction. b, The mt-genome was categorized into regions: OriL (red), D-loop (dark blue), tRNAs (purple), protein coding (light blue) and rRNAs (magenta). For each region, the probability of mutation was calculated as the total count of mutations normalized by the region length in bp multiplied by the average duplex read depth across the region. Fill indicates age group: young (hollow circles) and aged (filled circles). c, The difference in per cent bp mutated between young and aged mice for each mt-haplotype (n = 5 delta values for brain and heart; n = 4 delta values for liver). The shape denotes the average difference in per cent bp mutated with age across mt-haplotypes. Error bars showcase the standard error of the mean. Positions that exceeded a mutation frequency of 1 × 10⁻³ were excluded from these analyses. For b and c, frequencies were normalized for sequencing depth across conditions at each position, and mutation counts and duplex depth were aggregated across samples in an experimental condition to calculate the per cent bp mutated.
We next examined the variation in mutation rates and frequencies across different regions of the mt-genome (Fig. 2b,c). The density of mutations was lowest in functional coding regions (protein-coding, ribosomal RNA (rRNA) and transfer RNA (tRNA) segments) while the D-loop exhibited a significantly higher mutation frequency in both young (6.4-fold, P = 3.4 × 10⁻⁹; two-tailed t-test) and aged (4.5-fold, P = 8.6 × 10⁻⁸; two-tailed t-test) mice. However, we further found that the light strand origin of replication (OriL) had an even higher average mutation frequency, 40- to 22-fold in excess of the functional coding regions in young and aged mice, respectively (Fig. 2b). This OriL hotspot of mutation was most pronounced in aged wild-type B6 mice. The OriL was recently noted as a mutational hotspot in macaque liver, but not in oocytes or muscle in that species36. In contrast, we find the OriL to exhibit elevated mutation frequencies across the brain, heart and liver.
Our initial inspection of the overall distribution of mutations across the mt-genome highlighted several distinct clusters appearing at finer-scale resolution than our simple functional classification groups (Fig. 1f). To resolve these putative mutational hotspots we quantified the average mutation frequency in 150-bp sliding windows over the mt-genome independently across tissues and mt-haplotypes (Fig. 3a). In addition to the D-loop, this analysis identified mutational hotspots in OriL, MT-ND2 and MT-tRNAArg.
Fig. 3: Haplotype-specific peaks of mutation along the mt-genome.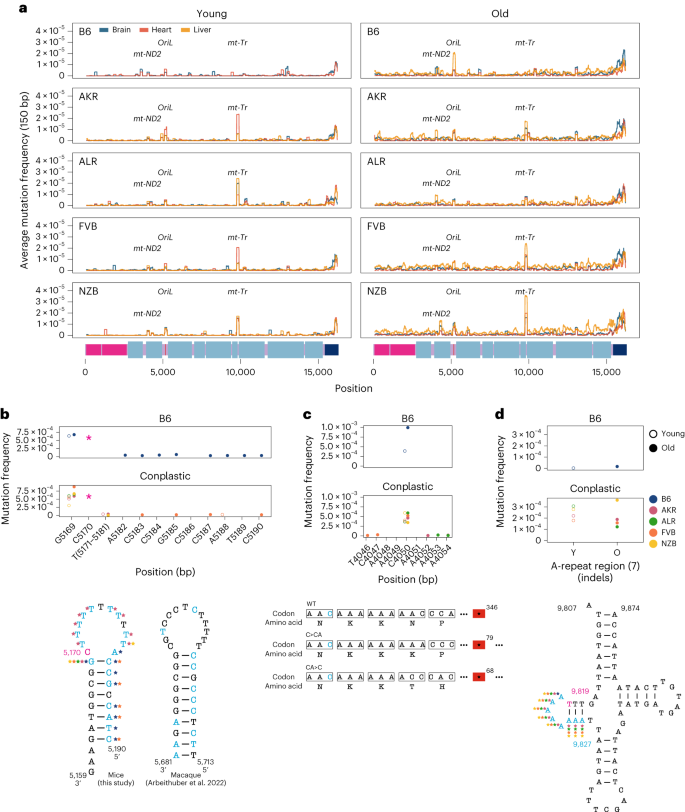
a, The average mutation frequency was calculated in 150-bp sliding windows for each strain and tissue independently. Each line represents a tissue: brain (blue), heart (red) and liver (orange). Regions with shared mutation frequency peaks in at least three mouse strains are labelled. b, The high-frequency region in the light strand origin of replication (OriL) is highlighted. For positions 5,171–5,181 the mutation frequency for the T-repeat region is calculated as the sum of mutations across this region divided by the sum of the duplex depth across positions. Each colour denotes a different strain: B6 (blue), AKR (pink), ALR (green), FVB (orange) and NZB (yellow). The average frequency in young (left, hollow points) and aged (right, filled points) mice is compared. The schematic compares the OriL structure in mice with that of macaques36. Positions with a mutation frequency >1 × 10⁻³ are in magenta, while other positions exibiting mutations are denoted in light blue. In the macaque OriL diagram, variant hotspots are denoted in light blue. Stars represent strains that have mutations present at a given position. c, The high-frequency region in MT-ND2 is highlighted. Colour, shape and calculation of the average mutation frequency are similar to those in b. A schematic demonstrating the sequence and codon changes that result from the indels at position 4,050: premature stop codons at codon 79 and 68 for C > CA and CA > C, respectively. The superscript denotes the position of the premature stop codon in the amino acid sequence. d, The mutation frequency for MT-tRNAArg from bp positions 9,820–9,827, which is an A-repeat region. The mutation frequency for the A-repeat region is calculated as the sum of mutations across this region divided by the sum of the duplex depth across positions. The diagram of MT-tRNAArg highlights in magenta the location of a fixed variant in NZB, which is a high heteroplasmic variant in the other mouse strains. Positions that have mutations in this region are in light blue. Positions that exceeded a mutation frequency of 1 × 10⁻³ were excluded from these analyses. Frequencies were normalized for sequencing depth across conditions at each position.
The OriL forms a stem–loop structure that is conserved across species40 but differs markedly in its sequence. We identified mutations throughout the loop and 5′ end of the stem with the highest mutation frequencies corresponding to changes in the size of the stem–loop (Fig. 3b). Repeated mutations of the 5′ end of the stem–loop structure mirror those observed in macaque liver in a recent study36, though the sequence of the stem differs between these two species. Thus, the conserved structure of the OriL appears to drive convergent mutational phenotypes between species.
The MT-ND2 mutation hotspot consists of a frameshift-inducing A insertion (INS) or deletion (DEL) that introduces a premature stop codon (Fig. 3c). This stop codon reduces the length of the final protein product by more than 250 amino acids, probably severely impacting its function. This mutation increases in frequency with age across all strains except NZB. The final mutation hotspot we identified is localized to an eight-nucleotide stretch of MT-tRNAArg (Fig. 3d). These nucleotides correspond to the 5′ D-arm stem–loop of the tRNA and constitute primarily A INS 2-4 nucleotides long. Computational tRNA structure predictions show that these mutations increase the size of the loop (Supplementary Figs. 5 and 6)41. This mutational hotspot exhibits strong strain specificity with B6 exhibiting few somatic mutations in this A-repeat stretch. The D-arm plays a critical role in creating the tertiary structure of tRNAs42,43 potentially contributing to its constraint in the wild type. Together, these results highlight the emergence of distinct mutational hotspots in mt-genomes occurring in age- and strain-specific contexts, and implicating both DNA and RNA secondary structures.
Replication errors and DEL distinguish aged mt-genomes
Somatic mutations are caused by various molecular processes that lead to DNA damage, each of which exhibits a distinct mutational signature44. To identify sources of mitochondrial somatic mutation, we categorized mutations into single nucleotide variants (SNVs), DEL and INS (Fig. 4a). SNVs were further classified into the six possible substitution classes (Fig. 4b). Overall, SNVs were the predominant somatic mutation type, with a fivefold higher average mutation frequency than DEL and INS in both young and aged individuals (Supplementary Fig. 7). The most abundant mutation type observed was G > A/C > T, which is indicative of replication error or cytosine deamination to uracil45,46 (Fig. 4b). The reactive oxygen species (ROS) damage signature of G > T/C > A (ref. 47) was the second most predominant mutation type. All somatic mutation types were used to identify two dominant mutational signatures using a multinomial bayesian inference model48 (Fig. 4c). These signatures explained the bulk of the variation across samples (Supplementary Fig. 8).
Fig. 4: Characterizing the mt-genome mutational landscape.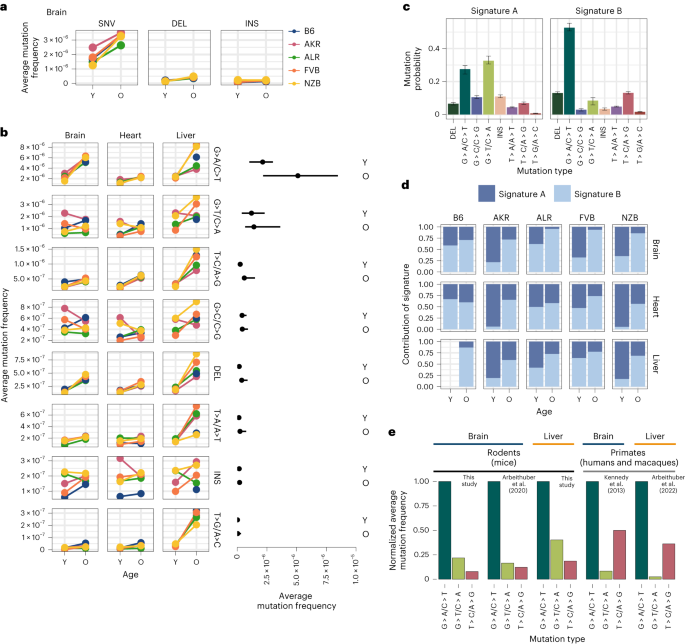
a, The average mutation frequency is compared between mt-haplotypes for different classes of mutations: SNVs, DEL and INS. The average mutation frequency was calculated as the total mutation count in a class divided by the total duplex bp depth. Each point denotes the average mutation frequency across the mt-genome for young (Y) and aged (O) mice in each strain (B6 (blue), AKR (pink), ALR (green), FVB (orange) and NZB (yellow)). The connecting line demonstrates the change in frequency from young to aged mice. Mutation counts and duplex depth were aggregated across samples for each condition to calculate the average mutation frequency. Results for the brain are featured, which showcase trends observed in the heart and liver, as well (Supplementary Fig. 7). b, SNVs were further classified into point mutation types. Each point denotes the average mutation frequency for the given mutation type across the mt-genome for each mouse strain (colour key as in a). The average frequency for point mutations was calculated as the total count of mutations of the given type divided by the duplex bp depth for the reference nucleotide. The average mutation frequency for DEL and INS was calculated as the total mutation count in these classes divided by the total duplex bp depth. Mutation types are ordered by descending average mutation frequencies. The range in frequency across experimental conditions (strain × tissue, n = 15 conditions for brain and heart; n = 14 conditions for liver) for each mutation type is shown. For each mutation type, the segment extends from the minimum to the maximum frequency across experimental conditions in the age group. Each point in the segment denotes the median frequency across conditions. c, Mutational signatures were extracted from mutation type counts for each experimental condition using sigfit. Two mutational signatures were identified. The probability that a mutation type contributed to a signature is showcased. Each bar denotes the estimated probability of a mutation type comprising the signature with error bars denoting the 95% confidence interval of each estimate. d, The presence of the mutational signatures was estimated for each condition (signature A dark blue, signature B light blue). The contribution of each mutational signature is compared across age. e, The frequency of the three most abundant mutation types were compared across mice, macaques and humans for the brain and liver. Mutation frequencies were normalized by the frequency of the G > A/C > T mutation in their respective study. All studies used duplex sequencing to profile mutations in the mt-genome. For the mutation frequencies in our study, we only show the mutation frequencies for B6. Refer to Supplementary Fig. 9a for frequencies across all strains, tissues and young mice. For all analyses, mutation counts and duplex bp depth were aggregated across samples in an experimental condition. Positions with mutation frequencies greater than 1 × 10⁻³ were omitted from these analyses.
The accumulation of somatic mutations with age is a well-known phenomenon that has been hypothesized to play key roles in the aetiology of lifespan49. We observed that four out of the eight mutation types significantly increased in frequency with age (adjusted P value <0.01; Fisher’s exact test with a Benjamini–Hochberg correction) (Fig. 4b and Supplementary Table 5) across all tissues, with T > A/A > T mutations additionally exhibiting age-associated accumulation in the liver but not in brain or heart. These age-associated signatures compose mutational signature B (Fig. 4c), which overall distinguishes aged from young samples (Fig. 4d). The consistency of these signatures across both mutations and mt-haplotypes suggest that these mutations occur in a ‘clock-like’ fashion in mitochondria over lifespan.
In contrast, INS, G > C/C > G, and G > T/C > A mutations did not exhibit consistent age-associated patterns. These mutations are represented in mutational signature A (Fig. 4c). Of particular note, the G > T/C > A and G > C/C > G mutation patterns are associated with ROS damage. An increase in ROS damage has been hypothesized to play an important role in ageing. Nonetheless, we do not find evidence of an increase in ROS-associated damage with age. Previous works in the human brain34,50, macaque tissues36 and various mouse tissues35,37 have also observed a lack of ROS-associated damage with age.
Species-specific mitochondrial mutational signatures
While the overwhelming majority of research into somatic mutation rates and profiles has focused on humans, comparative analyses can provide insight into the evolutionary processes that have shaped mutation. To determine if mitochondrial somatic mutation exhibited species-specific patterns, we compared several recent studies that duplex sequenced mt-genomes in multiple mouse, human and macaque tissues34,35,36,37. In our dataset, we found the relative magnitude of mutation frequencies to be consistent across tissues and mt-haplotypes with the G > A/C > T and G > T/C > A mutations being the most abundant (Fig. 4b and Supplementary Fig. 9a). This signature is consistent with other duplex sequencing-based analyses of mitochondrial mutations in young and aged mouse brain, muscle, kidney, liver, eye, heart and oocytes (Fig. 4e and Supplementary Fig. 9b,c)35,37. However, profiling of mitochondrial mutation signatures in several young and aged human brains noted transitions, G > A/C > T and T > C/A > G, to be the most abundant mutation signatures34 (Fig. 4e). We find that this pattern is also recapitulated in a recent dataset of mitochondrial somatic mutation in macaque muscle, heart, liver and oocytes (Fig. 4e and Supplementary Fig. 9d)36. These differences in mutational signatures were observed between primate and rodent species from duplex sequencing data generated independently by two research groups, emphasizing the reproducibility of this phenomenon. Together, these results suggest that rodent and primate mt-genomes are subject to distinct mutational processes, potentially as a cause or effect of physiological differences between these lineages.
Negative selection shapes mitochondrial mutation frequencies
While only 13 proteins are encoded on the mt-genome, these products are vital components of the electron transport chain. Given their importance, we investigated whether selection was acting to shape the mutational landscape of the mt-genome.
We calculated the \(\frac{{{\mathrm{hN}}}}{{{\mathrm{hS}}}}\) statistic51, which is akin to the \(\frac{{{\mathrm{dN}}}}{{{\mathrm{dS}}}}\) statistic, for every gene across our 29 experimental conditions. For each condition, we also simulated the expected distribution of \(\frac{{{\mathrm{hN}}}}{{{\mathrm{hS}}}}\) ratios using the observed mutation counts and mutational spectra (Supplementary Fig. 10). Prima facie, the mt-genome appeared to be shaped predominantly by positive selection (Fig. 5a). However, differences in the mutation spectrum between mutational hotspots, including the D-loop, could bias the simulated null distribution of mutations. Indeed, mutation spectra were substantially different between D-loop and non-D-loop mutations, as well as among mutations at different frequencies (Fig. 5b). Furthermore, quantifying the allele frequency spectrum of non-synonymous and synonymous mutations revealed that non-synonymous substitutions were strongly enriched at low frequencies compared with synonymous substitutions indicating that negative selection is probably preventing these mutations from increasing in frequency (Fig. 5c).
Fig. 5: Negative selection shapes the mt-genome.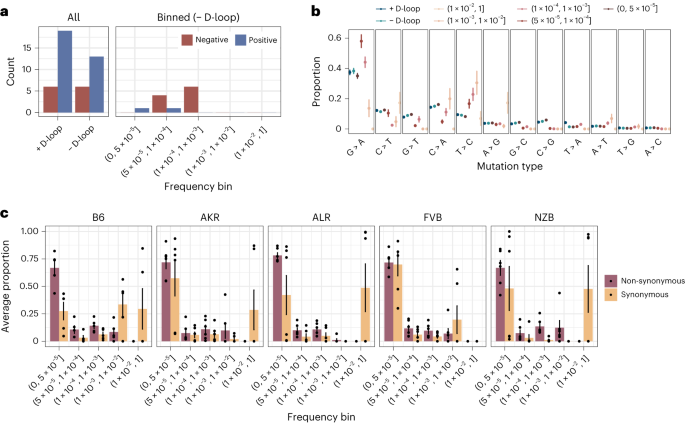
a, The count of genes under positive (blue) and negative (red) selection. Mutations and mutation type proportions were quantified in three different ways: (1) all mutations, without consideration of mutation frequency or mt-genome position, (2) all mutations excluding the D-loop, and (3) mutation counts binned by mutation frequency, excluding the D-loop. Mutations with a frequency greater than 1 × 10⁻³ were excluded from analyses 1 and 2. b, The proportion of each mutation type. Proportions are calculated as the count of mutations of each type divided by the total count of mutations in a given bin. The average mutation type proportion across experimental conditions (n = 29 conditions; strain × tissue × age) is shown with error bars denoting the standard error of the mean. In blue are proportions for the aggregated mutation counts with (dark blue) and without (light blue) the D-loop. Mutations are ordered in descending order of average mutation frequency. c, The frequency spectra for non-synonymous (purple) and synonymous (orange) mutations. The bar denotes the average proportion of non-synonymous and synonymous mutations in a bin. The proportion is calculated as the count of non-synonymous or synonymous mutations in a frequency bin relative to the total count of non-synonymous or synonymous mutations across all bins. The average proportion is taken across tissues and age in a strain (n = 6 except for B6, where n = 5). Each point represents the proportions that compose the average. The error bars denote the standard error of the mean. For these analyses mutation counts were aggregated across samples in an experimental condition.
We thus performed our \(\frac{{{\mathrm{hN}}}}{{{\mathrm{hS}}}}\) analyses independently in different frequency bins (Fig. 5a) revealing primarily signatures of negative selection. From the 12 possible cases of selection, 75% were in conplastic mice, and both cases of positive selection were in NZB mice. Genes with selective signatures include MT-CO1 (3), MT-CO3 (1), MT-CYTB (1), MT-ND2 (1) and MT-ND5 (6), whose protein products compose complexes I, III and IV of the electron transport chain. Intriguingly, signatures of negative selection in MT-ND5 were observed across all five strains in our experiment. Taken together, these results indicate that negative selection dominates the distribution of mutations in mt-genomes, though this signature is predominantly found at intermediate frequencies.
Mito-nuclear mismatches drive somatic reversion mutations
Mismatching of mitochondrial and nuclear haplotypes, such as in hybrid populations, has been associated with reductions in fitness5,6,7,8,9,10,11,12,13,15. The conplastic strains we employ are hybrids with mismatched nuclear and mt-genome ancestries. Since hybrids often demonstrate reduced fitness as a result of mito-nuclear discordance, we reasoned that at sites where the conplastic mt-genome differed from the B6 mt-genome (haplotype sites), there may be a preference for ‘reversion’ mutations to the B6 allele (Fig. 6a).
Fig. 6: Somatic reversion mutations segregate in the mt-genome population.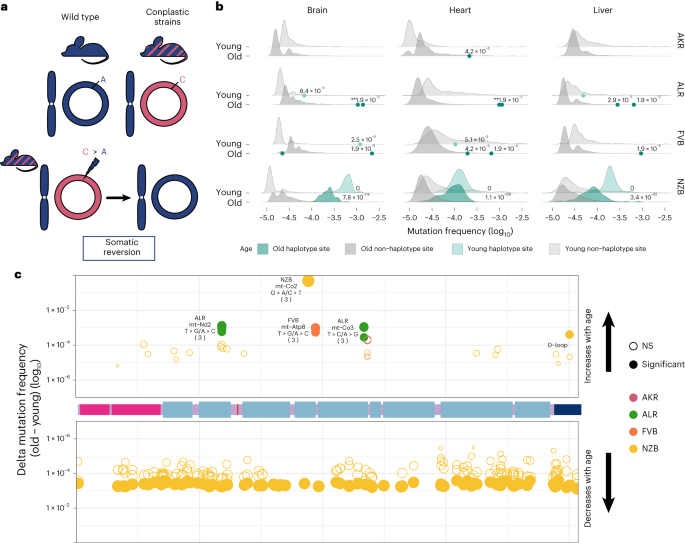
a, A schematic that explains somatic reversion mutations. The wild-type strain (B6) has matching nuclear and mt-genome ancestries (B6 ancestry denoted in blue). Conplastic strains are hybrids with mismatching nuclear and mt-genome ancestry. Haplotype sites are positions in the mt-genome where the conplastic mt-genome differs from the B6 mt-genome. Somatic reversion mutations refer to the re-introduction of B6 ancestral alleles at haplotype sites. b, The mutation frequency at non-haplotype sites (grey distributions) is compared with the mutation frequency at haplotype sites (green distributions or points when fewer than three haplotype sites exist). All mutations were included in the distribution of non-haplotype site mutation frequencies, including positions with a mutation frequency greater than 1 × 10⁻³. Haplotype site mutation frequencies were corrected for potential NUMT contamination. Mutation frequencies were normalized for sequencing depth between young and aged experimental conditions. Denoted are the adjusted empirical P value using the Benjamini–Hochberg correction. Asterisks denote the number of haplotype sites with the same P value. For AKR, ALR and FVB empirical P values for haplotype sites were calculated as the count of non-haplotype sites with a higher frequency than the haplotype site divided by the total number of non-haplotype sites (one-sided test). For NZB, the distribution of mutation frequencies for haplotype sites and non-haplotype sites was compared using the Wilcoxon rank-sum test. c, A map of the somatic reversion mutations along a linear mt-genome. Each point denotes the change in frequency with age (delta) for a somatic reversion mutation. The size of the point indicates the magnitude of delta and colour represents the conplastic strain the somatic reversion occurs in. Empirical P values were calculated as the count of sites with a delta greater (for sites with an increase in frequency with age) or less (for sites with a decrease in frequency with age) than the haplotype site delta divided by the total number of deltas (one-sided test). Fill denotes significance: not significant (NS) in hollow points and significant in filled points (adjusted empirical P value <0.02 using the Benjamini–Hochberg correction within each mt-haplotype group).
We hypothesized that if somatic selection were to favour the B6 allele, then reversions would occur at a higher rate than background mutations (Supplementary Table 6). Three of the strains have several fixed haplotype sites in their mt-genomes, ALR, FVB and NZB. We find that, in ALR and FVB strains, haplotype sites were among the most mutated sites in the mt-genome, with sixfold and sevenfold higher average mutation frequency than non-haplotype sites, respectively (Fig. 6b, adjusted P values <0.001). In NZB, which differs from B6 at 91 locations, these haplotypes sites had 122-fold higher mutation frequency than background (adjusted P values <1 × 10−53). The overwhelming majority (75–100%) of these mutations are reversions to the B6 allele with the specific reversion mutation occurring significantly more than expected by chance (Supplementary Table 7). These results demonstrate the extreme selective pressures impressed by nuclear–mitochondrial matching to re-introduce the ancestral allele.
We next hypothesized that if somatic selection were to favour reversions, these B6 reversion alleles should increase in frequency with age. We quantified the relative change in reversion frequencies across strains and found that in ALR and FVB all unique fixed sites exhibited a significant increase in the reversion allele frequency with age across all tissues (Fig. 6c and Supplementary Table 8, Benjamini–Hochberg adjusted P value <0.02). This suggests a strong benefit of these coding reversion substitutions in ALR and FVB strains. In contrast, in NZB we observed an overwhelming preference for reversion alleles to decrease in frequency with age, particularly in the brain (Fig. 6c and Supplementary Table 8). One potential explanation for this decrease in frequency compared with ALR and FVB is that the many NZB fixed substitutions exhibit epistatic interactions that manifest negatively if single reversions are not accompanied by mutations at other sites, though this is challenging to test. We did identify two cases in NZB of reversions that increase in frequency with age, a synonymous substitution in the MT-CO2 gene, and a noncoding mutation in the D-loop. Together, our results demonstrate that sites which contribute to mito-nuclear mismatching are prone to elevated levels of mutation with reversion alleles preferred across multiple tissues in populations. This preference for nuclear mitochondrial matching potentially drives somatic selection increasing the frequency of these alleles with age.





+ There are no comments
Add yours